Man City Vs Previous Treble Winners: Do City Have What It Takes? (SEE DATA)
![]()
LAGOS JUNE 9TH (NEWSRANGERS)-It’s almost been a week since Manchester City lifted the FA Cup trophy following their win against Rivals Manchester United. With the attention now turning to the Champions League final this weekend, a new analysis reveals whether The Blues are on track to take home the Treble this weekend.
In order to gauge how Pep’s team measures up against the iconic seven teams that have won the Treble, football experts at SeatPick have compared the current season’s match performance data of Manchester City to that of the previous Treble winners.
Key findings from the research:
- Despite winning 71.67% of their games this season, Manchester City’s current win rate is just 0.62% lower than the average win rate of previous treble winners set at 72.11%.
- Manchester City are currently playing the cleanest football compared to previous winners, receiving on average 30% fewer yellow cards per game and 76% fewer red cards per game than the average set by previous treble winners.
- City have also scored on average 2.34% fewer goals per game than that of previous treble winners.
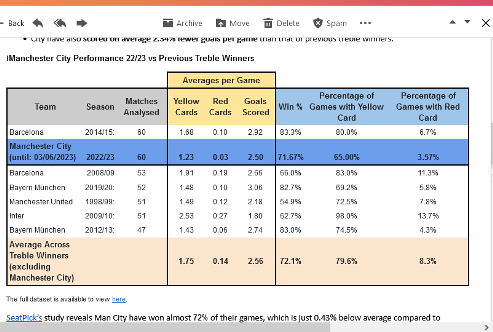
SeatPick’s study reveals Man City have won almost 72% of their games, which is just 0.43% below average compared to previous Treble winners. This is behind Treble winners, Barcelona (83.3%), Bayern Munchen 2019/20 (82.7%) and Bayern Munchen 2012/23 (83.%).

In the current season, Man City have played the cleanest compared to previous Treble winners as they’ve had the lowest average number of yellow cards (1.23) and red cards (0.03).
65% of games City have played this season have had at most one yellow card, and a mere 3.57% have had a red card, the lowest amounts compared to other Treble winners.
When it comes to goals, Manchester City scored an average of 2.5 goals per game, which is higher than both Inter and Manchester United’s goals tally when they won the Treble. Yet 2.34% fewer goals scored than the average of all Treble winners.
Comparing Manchester City to Manchester United’s 1998-99 victory
Should they win the Treble, it would put manager Pep Guardiola on a similar level to Man United’s legendary manager Alex Ferguson who helped them win the Treble back in 1999. This would only create more rivalry between fans of the two sides, but how do City measure up compared to The Red Devils?
Man City have been playing a cleaner game compared to United during their historic Treble-winning season. City has received an average of 1.23 yellow cards per game, while Man United has a slightly higher average of 1.49 yellow cards. Additionally, Man United has received more red cards on average per game, with an average of 0.12 red cards compared to City’s 0.03.
When it comes to scoring goals, City has scored an average of 2.50 goals per game, while United has scored an average of 2.18 goals per game. This indicates that City’s attacking prowess has been slightly superior to United’s throughout the season.
In terms of overall performance, City has been the more successful team. They have won over 71.67% of their games in the current season, while United’s win percentage stands at 54.9% when they won the Treble. This demonstrates City’s dominance in terms of securing victories.
Short URL: https://newsrangers.com/?p=109421